
To help visualise historical events in their respective time period, Charlotte Mason suggested making use of timelines or date charts. Although none of these charts were specified as required work on the programmes, they were mentioned elsewhere and we believe them to be suitable for Form I students.
A precursor to the Century Charts and Book of Centuries utilised in the upper forms, these charts add a fun and beneficial dimension to your study of History. There is no specified time in a lesson set apart for adding an entry to a time chart. This is because children need to connect with the people and events in their history reading and make their own choices as to when a specific instance deserves a space on the chart or timeline. Parents and teachers choosing what to add and when is essentially “doing the work for them”; therefore, it would do well to ask the child at the end of each lesson (after narration) whether there is anything they would like to add.
Students should be encouraged to add persons or events from across all their lessons, not just from History, so Bible, Literature, Geography, etc., can all afford material for filling in the charts.
Time charts are for the most part handmade. (Please see the ‘printables’ available in this post for downloadable versions of all the charts.) There is no real need for anything more fancy than some plain paper and pens from your own home. Please see below for more detailed instructions. (All chart instructions have been altered or adapted in some way to account for the needs of twenty-first century students.)
A Child’s Own History Chart
A Child’s Own History Chart was described briefly in a Parents’ Review Article, entitled ‘The Teaching of Chronology’, by Dorothea Beale (available to read at Ambleside Online here) as a way “to show that the life of each child forms part of history; [so that] we may lead him on to see that the whole world is different for each man that has lived, better for each noble life, and to feel quite early that God has sent him into the world with some work ready for him, and that his business is to do that work” [Beale, Parents’ Review, volume 2 [1891], pp. 81-90].
As a way of introducing the abstract concept of time to a child we bring it back to his own life, showing that, he, too, has a history and is a part of history.
This chart is intended to be maintained throughout the child’s life, with additions made each year.
1. Take a sheet of A4 or A3 paper or card and divide it into one hundred squares (10 squares across by 10 squares down), allowing space along the left side to make room for anniversary days and special events. This will represent a century which is about the “limit of man’s life”.
2. Place a small ‘0’ in the bottom right hand corner of the first square. This square stands for the time before he is a year old.
3. Place a number ‘1’ in the second square to indicate the year that he is now one year old, and so on, until we reach the last square which we mark as ‘99’.
“The first line gives the first decade of life, in the second line we have all the tens, in the third all the twenties, and so on; whilst, looking vertically downwards, we have in the first row all the numbers ending with zero; in the second those ending with one, and so on. A child very quickly learns to read on a black chart the number corresponding to any square in the century of squares.”
[Beale, Parents’ Review, volume 2 [1891], pp. 81-90].
4. Draw a thicker line down the centre to help the eye, and it will be “easy to remember that the fifty comes just beyond the central horizontal line and five beyond the central vertical line.
5. Write the child’s name and birth date across the top of the table.
6. Begin to fill in events from the child’s life up until the present. Rather than words describing events, however, we use symbols, so even non-writers can enjoy filling in their own charts.
“As an example, in the first square ‘0’ the child may draw a little yellow star to represent a new life coming into the world. Several squares later another star may represent the birth of a sibling. (Dates may then be written in the margins of the chart). Another square may tell the sad death of a grandparent, indicated by a black circle or perhaps a cross. And so it continues, with each year as every birthday comes around, the chart is taken from its resting place and new events are added, the blank squares gradually being diminished.”
[Beale, Parents’ Review, volume 2 [1891], pp. 81-90].
7. Place the chart in a frame with a removable back so that it can be updated each year and “it will be a joy for [the] children to look at in later life, as they remember the birthday addition each year, the sorrows and the joys there noted down, the prayers of the family for each new-comer, and the marriage days.” [Beale, Parents’ Review, volume 2 [1891], pp. 81-90].
Date Charts
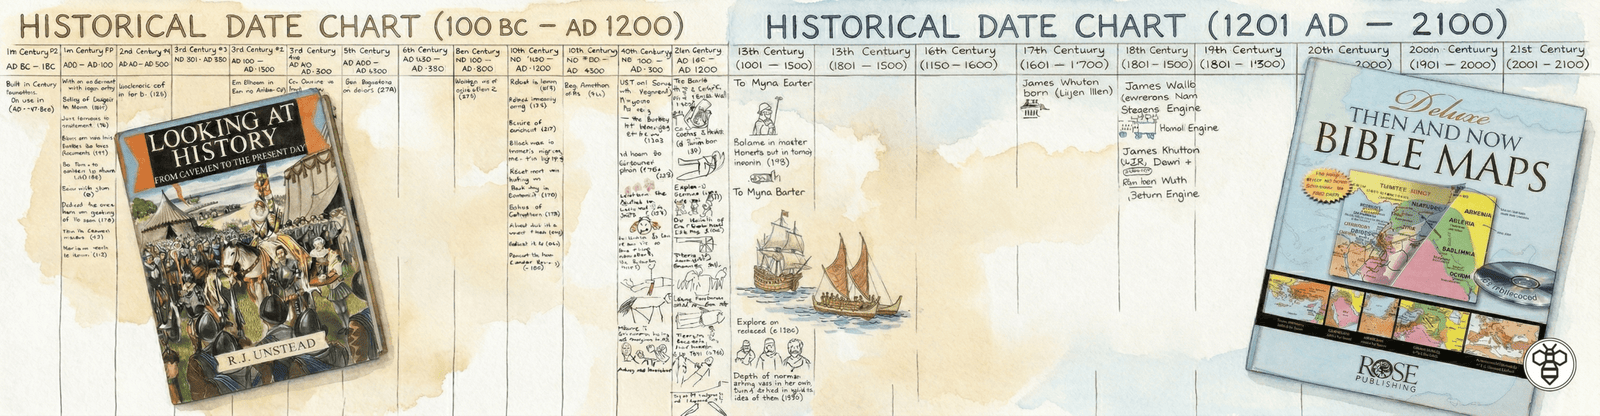
Date Charts were used “[i]n order to give definiteness to what may soon become a pretty wide knowledge of history” and “[w]e need not trouble ourselves at present with more exact dates, but this simple table of the centuries will suggest a graphic panorama to the child’s mind, and he will see events in their time-order.” [Mason, vol. 1, p. 292].
The following date chart has been adapted from Charlotte Mason’s chart described in Home Education and will span the years 100 B.C. to A.D. 1200, so as to cover the history period ordinarily being studied in the first year of formal lessons, Form IB. (Miss Mason describes a chart twenty columns wide which spans from approximately 1000 B.C. to A.D. 1000. The chart we describe here has been altered, however you may read Charlotte Mason’s own words on the subject in Home Education, p. 292.)
1. Take a sheet of (preferably) A2 paper or card (we recommend A2 as a minimum for a handmade Date Chart as anything smaller will result in columns that are too narrow for a child (or parent) to write in), or larger, and divide it into thirteen columns of equal size.
2. Label the first column as 1st Century B.C. (100 B.C. – 1 B.C.), the second as 1st Century A.D. (A.D. 1 – A.D. 100), the third as 2nd Century A.D. (A.D. 101 – A.D. 200), and so on, until the thirteenth column which will be labelled 12th Century (A.D. 1101 – A.D. 1200). (Please note that despite recent practice to celebrate a new century in ‘00’, a century always begins in the year ‘01’ and ends in the year ‘00’.)
3. Then let the child himself write, or print, as he is able, the names of the people he comes upon in due order, in their proper century.
4. Display it on the wall within easy reach of the children.
Timelines
Timelines are described by Winifred Irving in her P.N.E.U. pamphlet entitled ‘Notes on Making a Time-line’. She explains their usefulness by saying that “[f]ew things can do more than a time-line to integrate for a child the bewildering medley of personalities, inventions, battles, political struggles, artistic creations and social creations which make up History.”
Ms. Irving recommends that the keeping of a timeline should go side-by-side with that of other time charts. The timeline can be added to each year as the students progress through history and so in Form IB (assuming you are following Charlotte Mason’s English History rotation as described here) it will not be necessary to go beyond the year 1199.
The steps listed below have for the most part been taken directly from Ms. Irving’s article. If you feel so inclined you may wish to make the timeline yourself however at Charlotte Mason Beehive we offer a free download of the chart which is available at the end of this post. (Our versions of the timeline are based on the instructions given by Ms. Irving but may vary slightly in particulars.)
1. Take several sheets of lined paper, portrait side up. (“Lined paper is preferred as the lines provide a precise and ready-made scale of measurement, the space between each line standing for a chosen unit of time—say, five years.”)
2. Draw a rectangular box (approximately 1 inch in width) vertically up the left hand side of the page.
3. Divide the rectangle into sections by way of the reigns of the various sovereigns up until King Richard I. (Prior to King Egbert’s reign in 802 A.D., it may be well to note the time collectively as ‘Ancient Britain’.)
4. If so desired, coloured pens may be used to colour in each sovereign’s reign, and different colours may also be used for writing in the names of different categories of historical events, such as political events, battles, events of literary, artistic, or musical importance, etc.
5. To obtain the required length of time the sheets of paper can be fastened together and attached to the wall, allowing space for extending the timeline as and when required.
Printables